E-readiness in Kenya 2008
Results & Key Findings
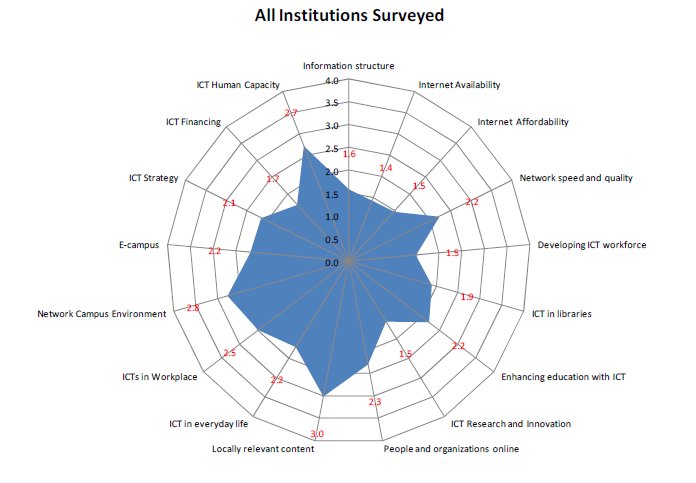
This study analyzed the results for each of the five categories of indicators for each university. Figure 1 summarizes the results by presenting the average stage for each of the 17 indicators in a radar diagram. We note that, on average, the East African universities were at stage 2.0 and above in 10 of the 17 indicators. However, they only achieved stage 3.0 in one indicator of Locally Relevant Content and stage 2.5 and above in only four of the 17 indicators. Our analysis suggests that accession depends on the institutional ICT strategy category of indicators much more than the other categories of indicators. This will therefore be the main focus of the accession phase of this project.

Average Staging for 17 Indicators for East African Universities
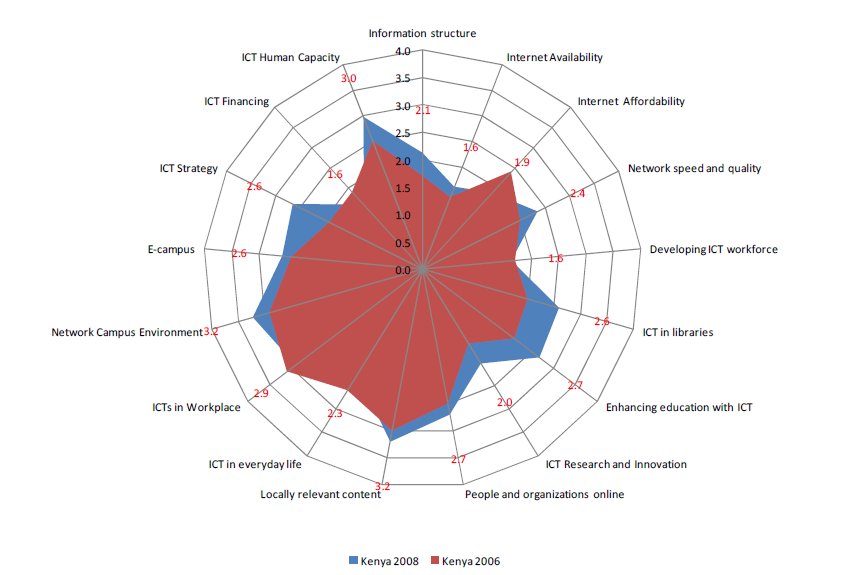
Although the report analyzed the staging results for each of the five participating countries (see Chapter 9), we highlight the results for Kenyan universities by comparing the 2006 and 2008 survey results as shown in Figure 2. We note that there has been no significant accession to higher stages for the 17 Kenyan universities in the past two years. However, the results presented in this report show that Kenyan universities surveyed on average, were at higher stages of readiness in all the 17 indicators when compared to the universities in the other four countries.

2006 and 2008 survey comparison for Kenyan universities
The results suggest that accession to stage 4 is a slow process and could take up to four years. Although phase 2 of this project will reveal the factors that influence accession to higher stages, anecdotal data suggests that the Kenyan universities that responded to the 2006 survey had achieved stage 3.0 and above in most of the 17 indicators in two years. Moreover, an increase in ICT strategy stage translated into significant changes in networked learning category of indicators.. Examples of Kenyan universities that recorded the most dramatic accession in staging included Strathmore University (private) and Kenyatta University (public).
The network access category consisted of four indicators: information infrastructure, Internet availability, Internet affordability, and network speed and quality. On average, the universities were below stage 2 in all except the network speed and quality indicator. The low score in information infrastructure meant that university campuses were not providing adequate internal and/or internal voice communication services. This low internal teledensity could be improved by well-designed campus infrastructure. For example, all of the 48 universities were purchasing only 152 Mb/s for the total population of about 330,000 students, an overall ratio of only 0.45 Mb/s per 1000 students, less than 50% of the target of 1 Mb/s per 1000 students recommended in the 2006 survey. Similarly, the PC ratios were all below the ratio of 10 PCs per 100 students with highest being 7.3 per 100 students in Rwanda and only 1.5 PCs per 100 students in Burundi. Burundi and Tanzania had very low PC ratios at less than 3 PCs per 100 students.
The Internet affordability at stage 1.5 meant that universities were spending about US$ 13,000 per 1000 students, which represented less than 1% of their annual budgets. At stage 4, universities would be required to spend over US$ 37,000 per 1000 students at the 2008 average satellite bandwidth prices in East Africa of about $2,100 per Mb/s per month (see demographic data in Chapter 4).
The institutional ICT strategy category of indicators consisted of three indicators: ICT strategy, ICT financing, and ICT human capacity. Overall, Kenyan universities with an aggregate of stage 2.4 were marginally at a higher stage than all other universities at stage 2.1. This stage in ICT strategy signified that less than half of the ICT strategy had been implemented and only 33% of the ICT strategies were aligned to the mission of the universities. Moreover, only about 18% of the ICT heads reported directly to the Vice Chancellors (VCs). This suggests that the universities still do not consider ICT as strategic tool for achieving their educational outcomes.
The universities were in stage 1.7 in ICT financing as shown in Figure 1 meaning that they were spending just about 0.3% of their annual budgets on Internet bandwidth (Internet bandwidth cost was used as a proxy for ICT financing). The universities therefore, on average, had the capacity to increase Internet bandwidth budget to about 2% of their total expenditure required to be in stage 4 in this framework, assuming satellite bandwidth prices of over US$ 2,100 per Mb/s per month.
The universities were at relatively higher stage of 2.7 in the ICT human capacity indicator suggesting that they were attracting highly qualified ICT staff and retaining them for two to three years. The heads of ICT had at least a Bachelor's degree in ICT and many had postgraduate qualifications. Therefore, universities in East Africa possessed the human capacity required for large-scale use of ICTs in their campuses and only needed greater alignment of their ICT strategies to their learning outcomes and significant increases in their ICT budgets.
The main purpose of accession to higher stages in the four indicator categories of network access, networked society, networked campus, and institutional ICT strategy was to ensure that ICTs were used effectively to support learning, teaching, and research. This was measured using the networked learning category of indicators that consisted of the following indicators: developing ICT workforce, ICTs in libraries, ICT research and innovations, and enhancing ICT with education.
The results in Figure 1 show that the universities were at stage 1.5 in Developing ICT Workforce indicator. This implied that they were not training their faculty in common productivity tools or using e-learning to develop the ICT of faculty and staff, which consequently affected the adoption of ICT for learning and research. The universities were also at stage 1.5 in the ICT Research and Innovations indicator. This meant, for example, that although 72% of the universities surveyed were offering undergraduate ICT degrees, only 30% offered ICT degrees at Master's level and 12% at doctoral level. Anecdotal data suggested that the throughput of the Masters and PhD programs was very low meaning the universities did not have the required capacity to support undergraduate degree programs. Moreover, only 43% of ICT departments participated in national and international ICT exhibitions.
The universities were at stage 1.9 in ICTs in libraries indicator, which meant that most libraries were not automated and OPAC was not available off-campus despite the fact that most of students did not reside in university campuses. The few universities that achieved stage 3 and above in the ICT libraries indicator had automated all their frontend and backend processes and provided off-campus OPAC services. Example universities included USIU and University of Nairobi in Kenya, and Makerere University in Uganda.
The enhancing education with ICT indicator was at stage 2.2, meaning that only about 50% of the universities had course management systems, used for managing online courses, like WebCT, Blackboard or Moodle. There was also limited use of ICT in the classrooms and a significant number of student projects did not have an ICT component. However, a few universities had started recognizing ICT as a tool for enhancing education, with some leading universities achieving stage 3.0 and above. In general, such universities were also the ones where the champion for ICT was the Vice Chancellor or at least a Deputy Vice Chancellor.
Overall, however, the East African university community exhibited a high readiness to use ICT as shown by the relatively higher stages in networked society category of indicators. The network society category consisted of four indicators: ICT in the workplace, ICT in everyday life, people and organizations online, and locally relevant content. Figure 1 shows that the university community (i.e., students, faculty and staff) exhibited relatively high level of readiness at stage 2.0 and above in these indicators. The lowest was in ICTs in everyday life at stage 2.2, which is an indicator of the diffusion of ICT outside the university campus as well as the low ICT access for students within campuses. Limited availability of ICTs in the universities was driving the community to cyber cafes for computer and Internet. For example, about 50% of student respondents considered the cyber cafe as their primary access to computers and the Internet. This percentage was highest in countries at low stages in networked campus category of indicators, such as Burundi where 87% of the student respondents considered cyber cafes as their primary location for access to the computers.
The East African university community also used computers largely for e-mail with up to 72% of the students in Kenya, reporting that they used computers to access e-mail. The use of computers for data analysis was significant (10% to 40% depending on the country) suggesting the use of computers for learning and research. Computers were also used for word processing (about 45% of student respondents) and for entertainment with about 50% of students in Kenya, Uganda, and Burundi reporting that they used computers and Internet for entertainment.
The results of gender analysis of the ICT revealed that there was no significant difference between the male and female students of the universities. This was also the finding in the 2006 study of Kenyan Higher Education community.
Internal vs. external factors of e-readiness of universities
Only three of the 17 indicators, namely, Internet availability, Internet affordability, and network environment (reliability of commercial power supply), directly depend on the external ICT environment. The governments in the all the East African countries had over the years improved the regulatory environment to ensure growth of the ICT sectors. Most of the universities surveyed were located in areas where commercial power was available but required backup generators and UPSs. The price of Internet was also expected to drop with availability of relatively cheap undersea optical fiber bandwidth from July 2009. This means that these three indicators that were directly affected by the external or national ICT environment will not be the key determinants of accession to higher stages in the important networked learning category of indicators. Instead, it will be internal institutional strategies that will determine accession to higher stages.
Although data on the Kenyan universities that used the results of the 2006 survey of their universities to revise their ICT strategies was not collected, anecdotal evidence suggests Kenyatta University and Strathmore University, may have used these results to improve on the stages of their indicators.
Strategic ICT sub-indicators
The2006 survey of e-readiness of higher education institutions in Kenya identified 15 sub-indicators that were considered strategic. These 15 strategic sub-indicators were selected from over 60 sub-indicators that were used to stage the 17 indicators. The purpose of identifying only 15 strategic indicators was to make it easier for universities to incorporate the indicators in their ICT and corporate strategies. In fact, the 2006 survey was summarized as an ICT strategy brief that could be used by the leadership of the universities [Kashorda and Waema, 2007b].
We note that most of the Kenyan universities had adopted two of the 15 indicators in their strategies, namely, PCs per 100 students and Internet bandwidth per 1000 students, as simple measures for investments in ICT. The PC ratio sub-indicator will continue to be important even as more students purchase their own computers and universities provide hotspots in their campuses. For example, this study found that a although 25% of students had access to computers at home, , the fact that about 50% of the students still had to access computers in cyber cafe's meant that universities needed to continue investing in in campus-based computer labs.
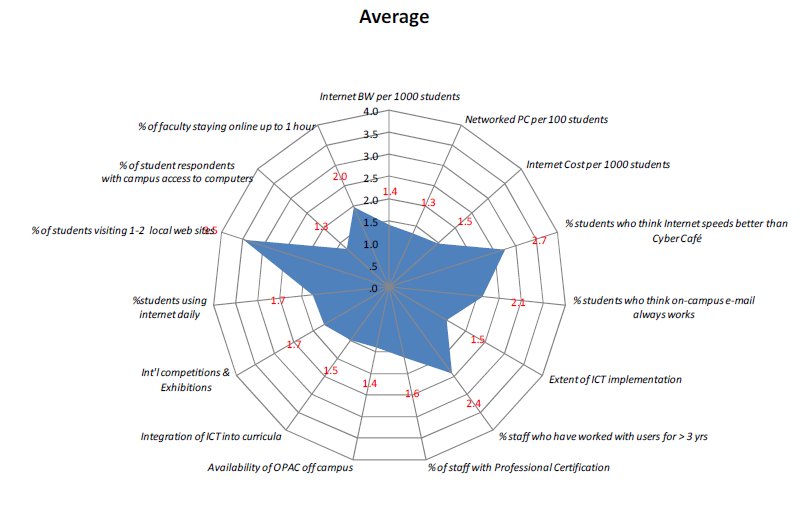
Figure 3 on the staging for the strategic indicators for all the East African universities included in the analysis, shows that nine of the 15 sub-indicators were below stage 2.0. For example, Internet bandwidth per 1000 students was at stage 1.4, while the networked PCs per 100 students sub-indicator was at stage 1.3. The universities were also spending relatively little on the Internet as measured by the Internet bandwidth cost per 1000 at stage 1.5. Consequently, the percentage of student respondents with campus access to computers was at stage 1.3.
The results in Figure 3 also show that the sub-indicator percentage of ICT implementation was at stage 1.5. This meant that only about 25% of the institutional ICT strategy had been implemented according to this staging framework. Thus, EA universities will need to pay greater attention to ICT strategy and incorporate the strategic sub-indicators in their strategic plans. Unfortunately, the results for Kenyan universities show that there has been no significant accession to higher stages. Only a few Kenyan universities (e.g., Strathmore Universities and Kenyatta University) recorded significant accession in the staging of these sub-indicators. We note that accession to higher stages in sub-indicators and indicators is a challenging change management process that requires focus on ICT by the senior leadership of the universities. The second phase of this accession project will aim to establish the key drivers for accession that could then be incorporated in the institutional roadmaps.

Average stages for 15 strategic indicators for all East African universities
Summary results and conclusions
The main conclusion of this survey is that the higher education community, especially the university community in Kenya, is ready to use ICT for learning, teaching, research and management. However, the institutional leadership appeared not to have recognized ICT as a strategic priority for transforming teaching, learning, and research. Consequently, institutions were allocating low operational budgets to ICT, did not invest adequately in campus networks, and did not have strategies for building the capacity of faculty to use ICT effectively to support their teaching and research activities. Most of the universities had not even automated their operational systems and processes, including library operations.
The 2006 e-readiness survey introduced 15 strategic sub-indicators. The accession in staging of the 15 strategic indicators for Kenyan universities did not show any significant accession to higher stages in the 2008 survey. This would suggest that most the Kenyan universities were not tracking the strategic sub-indicators and that ICT was still not considered a strategic tool by the university leadership. However, anecdotal evidence suggests that even universities that had adopted some of the 2006 survey recommendations were only using a few of the 15 strategic sub-indicators. We therefore recommend universities start accession by focusing on the following five strategic sub-indicators:
- Internet bandwidth cost per 1000 students
- Internet bandwidth per 1000 students
- PCs per 100 students
- Extent of ICT strategy implementation
- Integration of ICT in curricula
In almost all the 48 universities, ICT financial data was difficult to collect possibly because it was not treated as a separate expenditure or budgeting category at most of the universities. We recommend that universities create a separate budget line for ICT which includes Internet bandwidth, academic campus networks, associated salaries of ICT professionals, and the ICT capacity development for faculty.
This study did not factor mobile Internet usage sub-indicator in calculating the staging for Internet availability. Since about 50% of the student respondents reported that they were using mobile Internet, this would need to be factored in staging of the Internet availability indicator in the future. Data was also not collected to establish how, if at all, the students used the mobile Internet to support learning. Phase 2 of this project on innovative ICT projects will therefore give priority to innovative mobile learning technologies because of the pervasiveness of mobile phones in East Africa.
This report analyzed the effect of size on the staging of the 17 indicators. The universities were classified as small (1,000 - 2,500 students), medium-sized (2,501 - 5,000), large (5,001 - 20,000) and very large (over 20,000 students). The results show that size matters in terms of the average stages of most indicators. The researchers had expected that small universities to adopt ICT faster and therefore achieve higher staging in networked learning category of indicators (i.e., transform learning). However, the results showed that it was the very large and well-established universities that were effectively transforming learning using ICT as measured by the higher staging in networked learning category of indicators. Phase 2 of this project will aim to establish the factors that drive accession to higher for the different size categories of universities.